# !wget https://developer.nvidia.com/compute/cuda/9.0/Prod/local_installers/cuda-repo-ubuntu1604-9-0-local_9.0.176-1_amd64-deb
# !dpkg -i cuda-repo-ubuntu1604-9-0-local_9.0.176-1_amd64-deb
# !apt-key add /var/cuda-repo-9-0-local/7fa2af80.pub
# !apt update -q
# !apt install cuda gcc-6 g++-6 -y -q
# !ln -s /usr/bin/gcc-6 /usr/local/cuda/bin/gcc
# !ln -s /usr/bin/g++-6 /usr/local/cuda/bin/g++
# !curl -sSL "https://julialang-s3.julialang.org/bin/linux/x64/1.7/julia-1.7.3-linux-x86_64.tar.gz" -o julia.tar.gz
# !tar -xzf julia.tar.gz -C /usr --strip-components 1
# !rm -rf julia.tar.gz*
# !julia -e 'using Pkg; pkg"add IJulia; precompile"'
25. Weak IV Experiments#
# Import relevant packages
# Import relevant packages
# using Pkg
# Pkg.add("CSV")
# Pkg.add("DataFrames")
# Pkg.add("GLM")
# Pkg.add("FixedEffectModels")
# Pkg.add("DecisionTree")
# Pkg.add("PrettyTables")
# Pkg.add("CovarianceMatrices")
# Pkg.add("RegressionTables")
# Pkg.add("StatsFuns")
# Pkg.add("Plots")
# Pkg.add("RData")
# Pkg.add("MLBase")

using CSV, DataFrames, FixedEffectModels, DecisionTree, PrettyTables, CovarianceMatrices, RegressionTables, StatsFuns, Plots, RData, MLBase, GLM
function foo1(a;rng=MersenneTwister(3))
  return randn(rng,a)
end
foo1 (generic function with 1 method)
function foo2(a;rng=MersenneTwister(1))
  return randn(rng,a)
end
foo2 (generic function with 1 method)
    B = 1000
    IVEst = zeros( B )
    n = 100
    beta = 0.25

    U = foo1(n)
    Z = foo2(n)
    D = beta*Z+U
    Y = D + U;
    intercept = ones(length(U))
    data1 = DataFrame(intercept = intercept, U = U, Z = Z, D = D, Y = Y);

    mod = reg(data1, @formula(D ~ Z))
                             Linear Model
=======================================================================
Number of obs:                 100   Degrees of freedom:              2
R2:                          0.067   R2 Adjusted:                 0.057
F-Stat:                    7.01262   p-value:                     0.009
=======================================================================
D           |  Estimate Std.Error  t value Pr(>|t|) Lower 95% Upper 95%
-----------------------------------------------------------------------
Z           |  0.250108  0.094447  2.64814    0.009 0.0626815  0.437535
(Intercept) | 0.0873342 0.0949433 0.919856    0.360 -0.101078  0.275746
=======================================================================
IV =  reg(data1, @formula(Y ~ 0 + (D ~ Z)))
IV
                          IV Model
============================================================
Number of obs:            100  Degrees of freedom:         1
R2:                     0.752  R2 Adjusted:            0.749
F-Stat:               6.79219  p-value:                0.011
F-Stat (First Stage): 7.01315  p-value (First Stage):  0.008
============================================================
Y  | Estimate Std.Error t value Pr(>|t|) Lower 95% Upper 95%
------------------------------------------------------------
D  | 0.994509  0.381596 2.60618    0.011   0.23734   1.75168
============================================================
IV.coef
1-element Vector{Float64}:
 0.994509337024402
Note that the instrument is weak here (contolled by \(\beta\)) – the t-stat is less than 4.
25.1. Run 1000 trials to evaluate distribution of the IV estimator#
# dependent variable ~ exogenous variables + (endogenous variables ~ instrumental variables)
# Set seed
B = 1000
IVEst = zeros(B)


for i in 1:B

    U = randn( n)
    Z = randn( n)
    D = beta*Z+U
    Y = D + U
    intercept = ones(length(U))
    data2 = DataFrame(intercept = intercept, U = U, Z = Z, D = D, Y = Y);

    IV =  reg(data2, @formula(Y ~ + (D ~  Z)))

    IVEst[i,1] = IV.coef[2]
end
println(minimum(IVEst))
println(maximum(IVEst))
-40.368264648867964
57.83003936193075
IVEst
1000-element Vector{Float64}:
 -0.2633141021687235
  0.8948832260053269
 -0.20787697208091646
  0.6792079361265198
  1.052671004982911
 -0.7421608576444562
  1.1668318792400871
  0.933747261081341
  0.6850752909186767
  1.4639180207647025
 -0.9642817021998845
 -1.497309542643626
  1.2189323077695131
  ⋮
  5.460232661324924
  0.5478868710622211
  1.3717744154929605
  1.2644078444676423
  1.487865163308266
  0.7873831110483491
  0.7967961713080116
  0.9696312102644875
 -0.07785624411680934
  0.08917470799234822
  1.4232140851370487
  0.9943702695396225
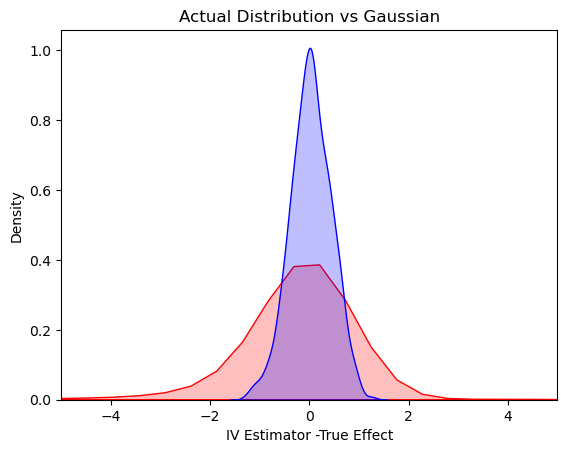
25.2. Plot the Actual Distribution against the Normal Approximation (based on Strong Instrument Assumption)#
val = collect(range( -5, 5.5, step = 0.05 ))
var = (1/beta^2)*(1/100) # theoretical variance of IV
sd = sqrt(var)

μ=0; σ=sd
d = Normal(μ, σ)
normal_dist = rand(d,1000)

# plotting both distibutions on the same figure
Seaborn.kdeplot(x = IVEst.-1, shade = true, color = "red")
Seaborn.kdeplot(x = normal_dist, shade = true, color = "blue")
Seaborn.title("Actual Distribution vs Gaussian")
Seaborn.xlabel("IV Estimator -True Effect")
Seaborn.xlim(-5,5)

(-5.0, 5.0)

