11. Heterogenous Wage Effects#
11.1. Application: Heterogeneous Effect of Gender on Wage Using Double Lasso#
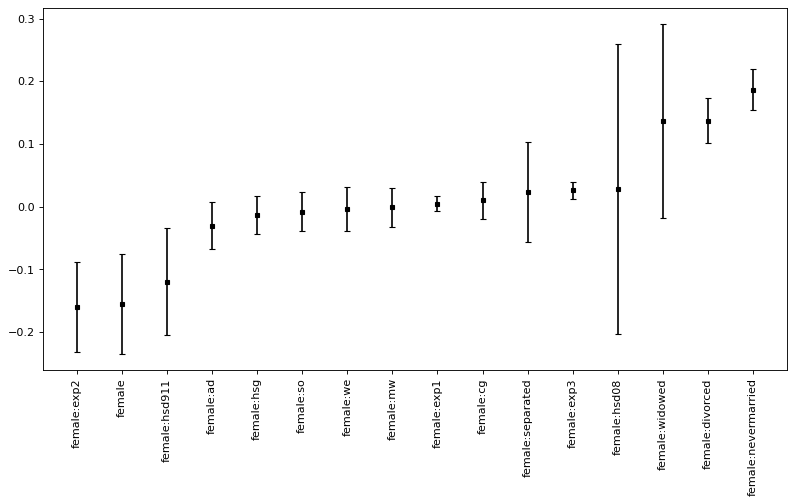
We use US census data from the year 2012 to analyse the effect of gender and interaction effects of other variables with gender on wage jointly. The dependent variable is the logarithm of the wage, the target variable is female (in combination with other variables). All other variables denote some other socio-economic characteristics, e.g. marital status, education, and experience. For a detailed description of the variables we refer to the help page.
This analysis allows a closer look how discrimination according to gender is related to other socio-economic variables.
import hdmpy
import pyreadr
import os
from urllib.request import urlopen
import patsy
import numpy as np
import pandas as pd
import matplotlib.pyplot as plt
from matplotlib.pyplot import figure
from scipy import stats
import numpy as np
import scipy.linalg as sci_lag
import warnings
warnings.filterwarnings('ignore')
link="https://raw.githubusercontent.com/d2cml-ai/14.388_py/main/data/cps2012.RData"
response = urlopen(link)
content = response.read()
fhandle = open( 'cps2012.Rdata', 'wb')
fhandle.write(content)
fhandle.close()
result = pyreadr.read_r("cps2012.Rdata")
os.remove("cps2012.Rdata")

# Extracting the data frame from rdata_read
cps2012 = result[ 'data' ]
cps2012.describe()
| year | lnw | female | widowed | divorced | separated | nevermarried | hsd08 | hsd911 | hsg | cg | ad | mw | so | we | exp1 | exp2 | exp3 | exp4 | weight | |
|---|---|---|---|---|---|---|---|---|---|---|---|---|---|---|---|---|---|---|---|---|
| count | 29217.0 | 29217.000000 | 29217.000000 | 29217.000000 | 29217.000000 | 29217.000000 | 29217.000000 | 29217.000000 | 29217.000000 | 29217.000000 | 29217.000000 | 29217.000000 | 29217.000000 | 29217.000000 | 29217.000000 | 29217.000000 | 29217.000000 | 29217.000000 | 29217.000000 | 29217.000000 |
| mean | 2012.0 | 2.797007 | 0.428757 | 0.007975 | 0.113393 | 0.016600 | 0.156347 | 0.004107 | 0.022179 | 0.247288 | 0.283431 | 0.155800 | 0.291645 | 0.282849 | 0.199644 | 18.756939 | 4.286811 | 10.875998 | 29.408779 | 1513.842566 |
| std | 0.0 | 0.662406 | 0.494907 | 0.088947 | 0.317078 | 0.127769 | 0.363191 | 0.063957 | 0.147267 | 0.431443 | 0.450671 | 0.362672 | 0.454528 | 0.450391 | 0.399740 | 8.767040 | 3.321506 | 11.121864 | 36.569919 | 1009.811610 |
| min | 2012.0 | -7.469874 | 0.000000 | 0.000000 | 0.000000 | 0.000000 | 0.000000 | 0.000000 | 0.000000 | 0.000000 | 0.000000 | 0.000000 | 0.000000 | 0.000000 | 0.000000 | 0.000000 | 0.000000 | 0.000000 | 0.000000 | 106.790000 |
| 25% | 2012.0 | 2.408296 | 0.000000 | 0.000000 | 0.000000 | 0.000000 | 0.000000 | 0.000000 | 0.000000 | 0.000000 | 0.000000 | 0.000000 | 0.000000 | 0.000000 | 0.000000 | 11.500000 | 1.322500 | 1.520875 | 1.749006 | 654.240000 |
| 50% | 2012.0 | 2.774540 | 0.000000 | 0.000000 | 0.000000 | 0.000000 | 0.000000 | 0.000000 | 0.000000 | 0.000000 | 0.000000 | 0.000000 | 0.000000 | 0.000000 | 0.000000 | 19.000000 | 3.610000 | 6.859000 | 13.032100 | 1472.100000 |
| 75% | 2012.0 | 3.181569 | 1.000000 | 0.000000 | 0.000000 | 0.000000 | 0.000000 | 0.000000 | 0.000000 | 0.000000 | 1.000000 | 0.000000 | 1.000000 | 1.000000 | 0.000000 | 26.000000 | 6.760000 | 17.576000 | 45.697600 | 1966.630000 |
| max | 2012.0 | 5.970942 | 1.000000 | 1.000000 | 1.000000 | 1.000000 | 1.000000 | 1.000000 | 1.000000 | 1.000000 | 1.000000 | 1.000000 | 1.000000 | 1.000000 | 1.000000 | 43.500000 | 18.922500 | 82.312875 | 358.061006 | 6444.150000 |
formula_basic =  '''lnw ~ -1 + female + female:(widowed + divorced + separated + nevermarried +
hsd08 + hsd911 + hsg + cg + ad + mw + so + we + exp1 + exp2 + exp3) + +(widowed +
divorced + separated + nevermarried + hsd08 + hsd911 + hsg + cg + ad + mw + so +
we + exp1 + exp2 + exp3) ** 2'''

y, X = patsy.dmatrices(formula_basic, cps2012, return_type='dataframe')
X.shape[1]
136
We have the same number of covariables.
variance_cols = X.var().to_numpy()
X = X.iloc[ : ,  np.where( variance_cols != 0   )[0] ]

def demean(x):
    dif = x - np.mean( x )
    return dif

X = X.apply( demean, axis = 0 )

index_gender = np.where( X.columns.str.contains('female'))[0]
The parameter estimates for the target parameters, i.e. all coefficients related to gender (i.e. by interaction with other variables) are calculated and summarized by the following commands:
effect_female = hdmpy.rlassoEffects( x = X , y = y , index = index_gender )
result_coeff = pd.concat( [ effect_female.res.get( 'coefficients' ).rename(columns = { 0 : "Estimate." }) , \
             effect_female.res.get( 'se' ).rename( columns = { 0 : "Std. Error" } ) , \
             effect_female.res.get( 't' ).rename( columns = { 0 : "t value" } ) , \
             effect_female.res.get( 'pval' ).rename( columns = { 0 : "Pr(>|t|)" } ) ] ,\
             axis = 1 )

print( result_coeff )
                     Estimate.  Std. Error   t value      Pr(>|t|)
female               -0.154593    0.048599 -3.180992  1.467717e-03
female:widowed        0.136096    0.094115  1.446056  1.481614e-01
female:divorced       0.136939    0.021680  6.316402  2.677227e-10
female:separated      0.023303    0.048849  0.477034  6.333381e-01
female:nevermarried   0.186853    0.020094  9.299104  1.416347e-20
female:hsd08          0.027810    0.140357  0.198140  8.429356e-01
female:hsd911        -0.119335    0.052223 -2.285101  2.230692e-02
female:hsg           -0.012885    0.018229 -0.706850  4.796595e-01
female:cg             0.010139    0.018079  0.560797  5.749360e-01
female:ad            -0.030464    0.022807 -1.335714  1.816429e-01
female:mw            -0.001063    0.018715 -0.056822  9.546869e-01
female:so            -0.008183    0.019027 -0.430096  6.671256e-01
female:we            -0.004226    0.021422 -0.197281  8.436076e-01
female:exp1           0.004733    0.007483  0.632488  5.270682e-01
female:exp2          -0.159519    0.043479 -3.668908  2.435892e-04
female:exp3           0.026512    0.008244  3.215830  1.300681e-03
'\\begin{tabular}{lrrrr}\n\\toprule\n{} & Estimate. & Std. Error & t value & Pr(>|t|) \\\\\n\\midrule\nfemale & -0.155 & 0.049 & -3.181 & 0.001 \\\\\nfemale:widowed & 0.136 & 0.094 & 1.446 & 0.148 \\\\\nfemale:divorced & 0.137 & 0.022 & 6.316 & 0.000 \\\\\nfemale:separated & 0.023 & 0.049 & 0.477 & 0.633 \\\\\nfemale:nevermarried & 0.187 & 0.020 & 9.299 & 0.000 \\\\\nfemale:hsd08 & 0.028 & 0.140 & 0.198 & 0.843 \\\\\nfemale:hsd911 & -0.119 & 0.052 & -2.285 & 0.022 \\\\\nfemale:hsg & -0.013 & 0.018 & -0.707 & 0.480 \\\\\nfemale:cg & 0.010 & 0.018 & 0.561 & 0.575 \\\\\nfemale:ad & -0.030 & 0.023 & -1.336 & 0.182 \\\\\nfemale:mw & -0.001 & 0.019 & -0.057 & 0.955 \\\\\nfemale:so & -0.008 & 0.019 & -0.430 & 0.667 \\\\\nfemale:we & -0.004 & 0.021 & -0.197 & 0.844 \\\\\nfemale:exp1 & 0.005 & 0.007 & 0.632 & 0.527 \\\\\nfemale:exp2 & -0.160 & 0.043 & -3.669 & 0.000 \\\\\nfemale:exp3 & 0.027 & 0.008 & 3.216 & 0.001 \\\\\n\\bottomrule\n\\end{tabular}\n'
t_value = stats.t.ppf(1-0.05, 29217 - 116 -1 )
pointwise_CI = pd.DataFrame({ '5%' : result_coeff.iloc[ : , 0 ] \
                                     - result_coeff.iloc[ : , 1 ] * t_value ,\
                              '95%' : result_coeff.iloc[ : , 0 ] \
                             + result_coeff.iloc[ : , 1 ] * t_value })
pointwise_CI
result_coeff = result_coeff.sort_values('Estimate.')

x = result_coeff.index

coef = result_coeff.iloc[ : , 0 ].to_numpy()

sd_error = ( result_coeff.iloc[ : , 1 ] * t_value ).to_numpy()

figure(figsize=(12, 6), dpi=80)

plt.errorbar( x = x , y = coef , yerr = sd_error , linestyle="None" , color = "black", \
              capsize = 3 , marker = "s" , markersize = 3 , mfc = "black" , mec = "black" )
plt.xticks(x, x, rotation=90)
plt.show()

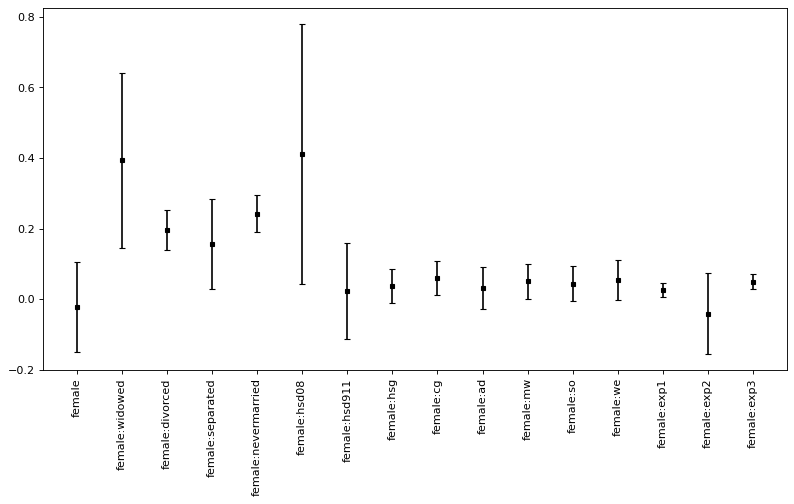
Now, we estimate and plot confident intervals, first “pointwise” and then the joint confidence intervals.
effect_female.res.get( 'coefficients' ).iloc[ :, 0 ].to_list()
[-0.1545932731827906,
 0.13609550288298192,
 0.13693939221511991,
 0.023302771994035233,
 0.18685348640356858,
 0.027810312784543743,
 -0.11933503921829447,
 -0.01288483245739874,
 0.010138550922289817,
 -0.0304637472338401,
 -0.0010634393390639041,
 -0.008183337595043904,
 -0.004226127118997856,
 0.004732893281720598,
 -0.15951933512468575,
 0.026512194276155938]
def confint_joint_python( rlassomodel , level = 0.95 ):

    coef = rlassomodel.res['coefficients'].to_numpy().reshape( 1 , rlassomodel.res['coefficients'].to_numpy().size )
    se = rlassomodel.res['se'].to_numpy().reshape( 1 , rlassomodel.res['se'].to_numpy().size )

    e = rlassomodel.res['residuals']['e']
    v = rlassomodel.res['residuals']['v']

    n = e.shape[0]
    k = e.shape[1]

    ev = e.to_numpy() * v.to_numpy()
    Ev2 = (v ** 2).mean( axis = 0 ).to_numpy()


    Omegahat = np.zeros( ( k , k ) )


    for j in range( 0 , k ):
        for l in range( 0 , k ):
            Omegahat[ j , l ] = ( 1 / ( Ev2[ j ] * Ev2[ l ] ) ) * np.mean(ev[ : , j ] * ev[ : , l ] )
            Omegahat[ l , j ] = ( 1 / ( Ev2[ j ] * Ev2[ l ] ) ) * np.mean(ev[ : , j ] * ev[ : , l ] )

    var = np.diagonal( Omegahat )

    B = 500
    sim = np.zeros( B )

    for i in range( 0 , B ):
        beta_i = mvrnorm( mu =  np.repeat( 0, k ) , Sigma =  Omegahat / n )
        sim[ i ] = ( np.abs( beta_i/ ( var ** 0.5 ) ) ).max()

    t_stat = np.quantile( sim , level )

    low_num = int( np.round( ( 1 - level ) / 2, 2) * 100 )
    upper_num = int( np.round( ( 1 + level ) / 2, 2) * 100 )

    sd_tstat = t_stat * ( var ** 0.5 )

    low = coef - sd_tstat
    upper = coef + sd_tstat

    table = pd.DataFrame( { f'{low_num}%' : low.tolist()[0] , f'{upper_num}%' : upper.tolist()[0] , \
                           'Coef.' : rlassomodel.res.get( 'coefficients' ).iloc[ :, 0 ].to_list() }, \
                         index = rlassomodel.res.get( 'coefficients' ).index )

    return ( table, sd_tstat )
def mvrnorm( mu , Sigma , n = 1 ):
    p = mu.size

    ev = np.linalg.eig( Sigma )[ 0 ]
    vectors = np.linalg.eig( Sigma )[ 1 ]

    X = np.random.normal(0, 1 ,  p * n ).reshape( n , p )

    diagonal = np.diag( np.maximum( ev, 0 ) ** 0.5 )

    Z = mu.reshape( p , 1 ) + vectors @ ( diagonal @ X.transpose())

    resultado = Z.transpose()

    return( resultado )
Finally, we compare the pointwise confidence intervals to joint confidence intervals.
from statsmodels.sandbox.stats.multicomp import multipletests
import scipy.stats as st
joint_CI =  confint_joint_python( effect_female, level = 0.9 )[0]
size_err =  confint_joint_python( effect_female, level = 0.9 )[1]
joint_CI
| 5% | 95% | Coef. | |
|---|---|---|---|
| female | -0.287258 | -0.021928 | -0.154593 |
| female:widowed | -0.120818 | 0.393009 | 0.136096 |
| female:divorced | 0.077758 | 0.196121 | 0.136939 |
| female:separated | -0.110045 | 0.156651 | 0.023303 |
| female:nevermarried | 0.132002 | 0.241705 | 0.186853 |
| female:hsd08 | -0.355334 | 0.410954 | 0.027810 |
| female:hsd911 | -0.261893 | 0.023223 | -0.119335 |
| female:hsg | -0.062645 | 0.036875 | -0.012885 |
| female:cg | -0.039213 | 0.059490 | 0.010139 |
| female:ad | -0.092722 | 0.031795 | -0.030464 |
| female:mw | -0.052152 | 0.050025 | -0.001063 |
| female:so | -0.060122 | 0.043756 | -0.008183 |
| female:we | -0.062703 | 0.054251 | -0.004226 |
| female:exp1 | -0.015694 | 0.025160 | 0.004733 |
| female:exp2 | -0.278207 | -0.040832 | -0.159519 |
| female:exp3 | 0.004007 | 0.049017 | 0.026512 |
x = joint_CI.index

coef = joint_CI.iloc[ : , 1 ].to_numpy()

sd_error = size_err

figure(figsize=(12, 6), dpi=80)

plt.errorbar( x = x , y = coef , yerr = sd_error , linestyle="None" , color = "black", \
              capsize = 3 , marker = "s" , markersize = 3 , mfc = "black" , mec = "black" )
plt.xticks(x, x, rotation=90)
plt.show()


